Last year ended in a rush to patch the Log4j vulnerability. Most organisations lack controls to prevent or even detect exploitation of log4shell and similar vulnerabilities. That meant overtime, blocking productivity and costly delays. Once the dust settled, I started looking at options for reducing the cost in similar events.
We want to increase detection capacity. Educate developers on the consequences of typical risks. We want to lower the investigation time so that security engineers can focus on coordination instead of fact-finding. We want the solution to be portable so that we don’t depend on environment-specific detections and controls.
If you feel that this method could be useful in your orgnisation, just reach out, I’ll be happy to show you how!
Introduction
I was introduced to this concept via Wiliam Jardine from F-Secure wrote an article on how to implement attack-aware applications in practice. The idea is that there are checks inside the application that measure how the application is being used and make automated decisions based on the usage. When the application usage resembles an attack pattern, it can take restrictive measures to defend itself.
Here are some examples where such patterns are applied today:
- In insurance, it’s used to detect fraud in large datasets.
- Predictive models and heuristics are used to find hidden relationships and anomalies.
- In finance/banking/payment, regulations mandate that risk behaviour such as money laundering, support of terrorism and tax avoidance are detected.
- The test points are clientele, distribution channel and geographical aspects.
- In the automotive industry, it is used to detect faulty parts and risk of collision.
- Sensor data from runtime operations and self-diagnostics.
These are all domain-specific usages of risk-aware application patterns. In all of these cases, manual oversight of the decision-making process is costly or unfeasible. The data load is too high, and the time to process is too slow if humans are involved.
The goal of using this pattern is to:
- Reduce alarm fatigue for investigators
- Create automatic action from events
- Improve log coherence and remove blockers from the investigation
This method uses application logs to improve software security and quality.
The pattern:
- Qualify one or multiple test points for one risk event indicator.
- Collect risk event indicators in a centralised function.
- Assign a confidence level and risk score to the event in the centralised function.
- Group risk events and send them to the centralised log function.
- Choose an action relevant for the given event, risk score and confidence.
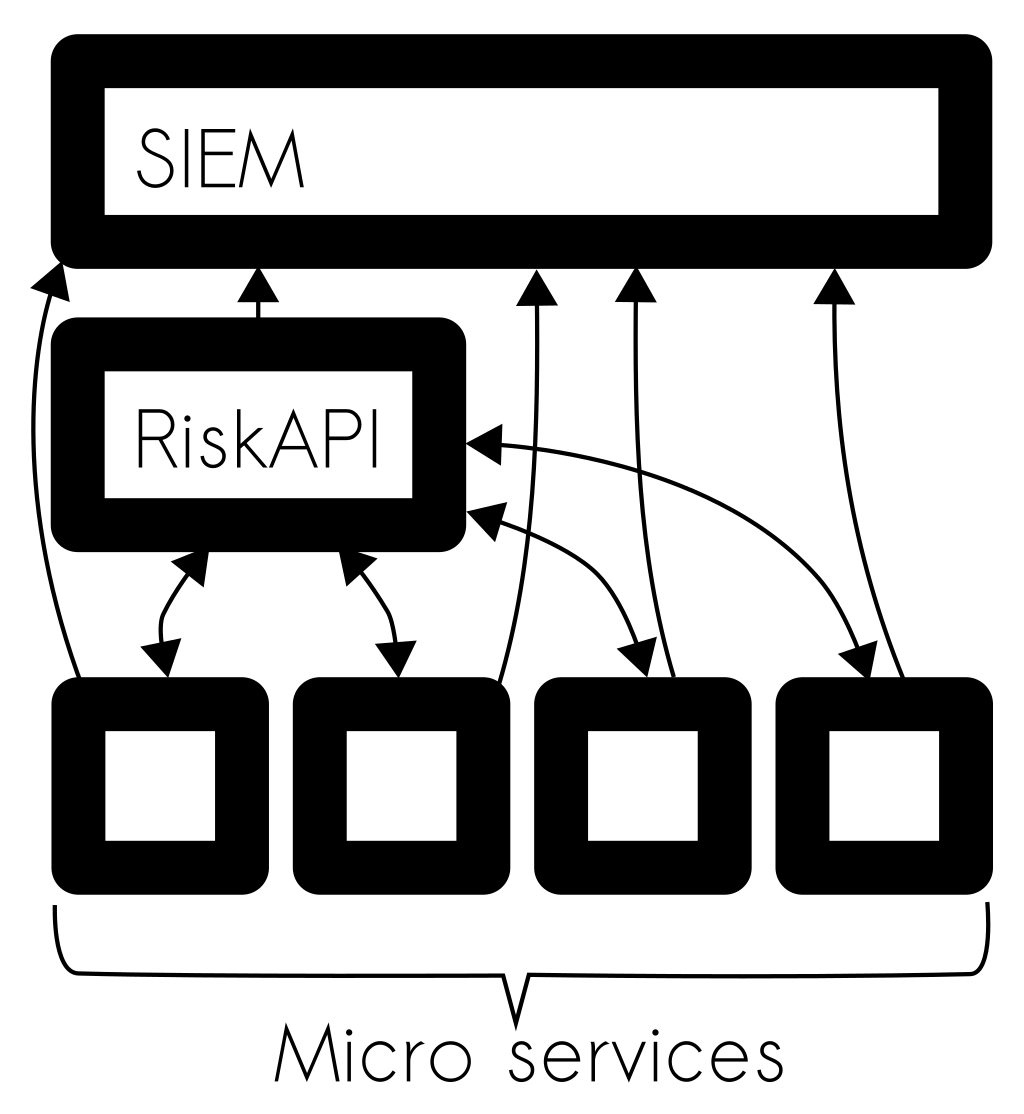
Each application is too small to make its own risk decisions in a microservice architecture. Therefore, a centralised function called a Risk API trigger actions and a SIEM solution trigger alerts.
Generic risks
The OWASP Application Sensor framework presents a few generic detection points and actions for web applications.
The detection point
In the OWASP detection points list, we find a few categories of simple risk behaviours.
The first two detection points are RequestExceptions. They describe the event of a browser using the wrong verb or command, for instance, using OPTIONS instead of GET in the HTTP request. These two can indicate an unintended request by an authenticated victim (Cross-Site Request Forgery).
The actions
Multiple actions mitigate the detection event. There are four action types.
- Silent: User(s) unaware of any application change
- Log the event
- Alert and event and highlight the logged entry
- Toggle log-level in the application
- Passive: Process altered, but the user(s) may continue to process completion
- User notification
- Force the client to respond to a captcha
- Change timing (see Kvicksand)
- Active: Functionality reduced or disabled
- Reject invalid input
- Account lockout
- Disable functionality
- Intrusive: Non-malicious action on user’s system
- Collect data from the user using client-side code
Feature specific risks and threat modelling
The detection points described by OWASP are user-centric and generic; they do not venture out to platform limitations or exceptions caught by the application.
In threat modelling, controls mitigate risks. Often risks cannot be fully mitigated using one single control. Multiple detection points and actions apply to one single risk. The strategy is to create security in depth.
During the threat modelling exercise, developers decide on reasonable detection points for the risk. The detection points are log commands storing relevant information about the application state. If multiple detection points give clear indications that risk has occurred, the confidence level of the event is high. The confidence score can be adjusted in an central Risk API component later to be coherent with the rest of the system.
Advanced events and actions
As the developers are adjusting to a risk-aware mindset, it will become more apparent how to write code that reduces the risk of vulnerabilities. They will also learn more about the risks while monitoring the events triggered by the detection points.
Once you have applied detections points for generic risks and started exploring feature specific risks, you have acquired the capacity to detect unknown risks (aka zero-day risks).
Platform security in the application
A vast majority of the tools that do intrusion detection reside on a platform level. They may have the capacity to inspect packets rudimentarily but have little understanding of the application state (WAF and IDS).
However, within the context of the application, the same information may indicate an intrusion into an application. If the file conversion tool ImageMagick throws IO-Exceptions, there is a chance that we are dealing with Remote Code Execution exploitation of the library. Similarly, if a PDF renderer throws a Connection Timeout, this means that the PDF renderer was trying to reach a remote server (Server Side Request Forgery).
Adding platform security detection capacity to the application layer improves portability. The environment security should not rely on using a specific cloud provider unless you are ready to pay the price of vendor lock-in.
Platform exceptions to look out for:
- Permission errors
- May occur if an attacker attempts to write to a directory where they don’t have permission (
Path Traversal).
- May occur if an attacker attempts to write to a directory where they don’t have permission (
Connection RefusedandConnection Timeout- Occurs if an attacker manages to create a request from the server to a destination that is not available (
Server Side Request Forgery).
- Occurs if an attacker manages to create a request from the server to a destination that is not available (
- Out Of Memory
- An attacker attempts to load additional functionality into the application and cause a crash (
Remote Code Execution).
- An attacker attempts to load additional functionality into the application and cause a crash (
- Illegal Argument Exception
- If this error occurs after input validation, the input validation has been bypassed by the attacker.
- Outlier Round Trip Time If an attacker can execute arbitrary code or use existing functionality to extract a sizeable amount of information from the server, the request tends to produce longer response times.
- Database errors
- The database reports a syntax error in a query. Syntax errors in the database log indicate that a user has altered a database query (
SQL injection).
- The database reports a syntax error in a query. Syntax errors in the database log indicate that a user has altered a database query (
Essentially we are trying to catch very unexpected errors and use these as Indicators of Compromise (IoC).
Manual Actions
Some actions will require manual intervention. Such events must contain qualifying information for intervention to be helpful. In this graduation, the event exception handler must meet the criteria defined by the Security Operation Center (SOC).
The graduation criteria are a clearly defined list of information points the SOC staff requires to take action.
Here is an example format:
{
   "EventId": String,
   "EventName": String,
   "EventType": String,
   "EventTime": Int,
   "RiskScore": Int,
   "RiskProbability": Int,
   "Breach": Bool,
   "Request": String,
   "ChildEvent": String,
   "Description": String,
   "Action": String,
   "Instruction": String,
   "EventOwner": String
}
Security Operation Center staff work with clear Indicators of Compromise. The SoC tend to focus on platform security indicators based on the mitre attack framework because these indicators are clear cut and have a low degree of false positives. The Indicators of Compromise (IoC) produced by the risk-aware applications must also be mature and well qualified to be accepted into the SOC.
Risk Queries
Queries are search terms used to create events. The queries search the log output for patterns that have IoC. There are two types of queries, production queries and investigation queries.
Production queries
A production query must be graduated using the qualification process.
- The production query must result in an event with a high probability.
- Only one unique result type should be the result of a production query.
- Its indicators may include an event hash/identifier to find further information.
Investigation queries
An investigation query simplifies the investigation by collecting relevant information. An investigation query can be a query that collects all available information about a given client for deeper scrutiny. Perhaps a query to find other accounts with similar criteria as an offending account.
- The investigation query can have low reliability.
- It can have manual steps.
- It is typically used to find similarities with multiple results.
Harmonising the logs
A pre-requisite for making automated decisions based on logging is that the log methodology and format are the same among all components.
Some prefer to log to stdout; others use logging frameworks such as Syslog-ng for their logs. The main thing here is to use one single modus for every application.
Time synchronisation in all application environments is vital for log coordination.
The log events must be formatted in the same manner regardless of the application layer. Using a structured serialisation format such as JSON may improve structure drastically. The NCSA format used by Apache is standard among traditional UNIX applications.
Application errors tend to vary in format between architectures. Attempting to structure the output of backtraces may save time later. Imagine that you will want to do fuzzy matching in similar field types in different applications for exceptions of a particular type. The fuzzy match will be easier to perform if the fields data use the same encoding and naming schemes.
Last but not least, logs have a severity indicator or log level. These are “FATAL”, “WARNING”, “ERROR”, “INFO” and “DEBUG”. Adhering to a logging policy means that the correct type of log message is grouped or visible at the right time. The Risk API can toggle the production log level of a given application to collect more detailed information if a high severity event occurs.
Detecting the log4shell vulnerability was easier on an application running with log level “DEBUG” than one running on “INFO”.
Roadmap
Here is an example of a roadmap to introduce application-aware logging:
- Harmonise the log format across the application.
- Add rudimentary detection query in
logging/SIEMservice (Splunk/ELK). - Introduce application risk awareness into the threat model.
- Add common generic detection points for new features.
- Add feature specific detections for mature developers.
- Qualify events in
Risk API/Logging servicefor production alarms (toSoC). - Create security automation using a
Risk APIwhere active actions can trigger an altered user journey.
Thank you
For this issue, I want to thank Lars Gråmark and Alexander Mohlin for discussing application logging potentials.
Considerations
While writing this post, I struggled with distinguishing between Risk API and SIEM. The Risk API solution works like a detection and response solution (MDR). One example of a Risk API product is castle.io. Taking active action requires using a Risk API while detecting fault requires a SIEM.
Future work
Investigate how to use tracing and application profiling to speed up the investigation phase.